Multiple Choice
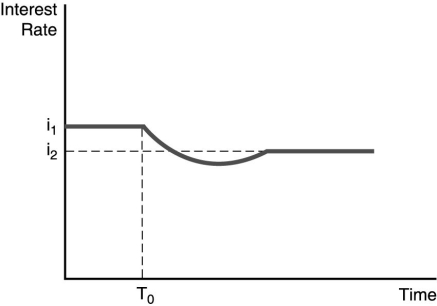
-The figure above illustrates the effect of an increased rate of money supply growth at time period T₀. From the figure, one can conclude that the ________.
A) Fisher effect is dominated by the liquidity effect and interest rates adjust slowly to changes in expected inflation
B) liquidity effect is dominated by the Fisher effect and interest rates adjust slowly to changes in expected inflation
C) liquidity effect is dominated by the Fisher effect and interest rates adjust quickly to changes in expected inflation
D) Fisher effect is smaller than the expected inflation effect and interest rates adjust quickly to changes in expected inflation
Correct Answer:

Verified
Correct Answer:
Verified
Q14: If fluctuations in interest rates become smaller,then,other
Q16: Keynes assumed that money has _ rate
Q18: When real income _,the demand curve for
Q28: You would be less willing to purchase
Q39: Demonstrate graphically and explain the effect in
Q70: Use the following figure to answer the
Q93: <img src="https://d2lvgg3v3hfg70.cloudfront.net/TB5039/.jpg" alt=" -In the figure
Q97: In a business cycle expansion,the _ of
Q109: Pieces of property that serve as a
Q133: A higher _ means that an asset's