Multiple Choice
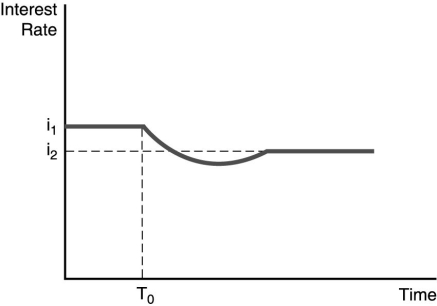
-The figure above illustrates the effect of an increased rate of money supply growth at time period T₀. From the figure, one can conclude that the ________.
A) liquidity effect is smaller than the expected inflation effect and interest rates adjust quickly to changes in expected inflation
B) liquidity effect is larger than the expected inflation effect and interest rates adjust quickly to changes in expected inflation
C) liquidity effect is larger than the expected inflation effect and interest rates adjust slowly to changes in expected inflation
D) liquidity effect is smaller than the expected inflation effect and interest rates adjust slowly to changes in expected inflation
Correct Answer:

Verified
Correct Answer:
Verified
Q5: Everything else held constant,an increase in the
Q17: <img src="https://d2lvgg3v3hfg70.cloudfront.net/TB5039/.jpg" alt=" -In the figure
Q23: The riskiness of an asset is measured
Q36: Demonstrate graphically the effect of an increase
Q38: Both the CAPM and APT suggest that
Q61: Everything else held constant,when households save less,wealth
Q92: When the inflation rate is expected to
Q107: Everything else held constant, if the expected
Q145: <img src="https://d2lvgg3v3hfg70.cloudfront.net/TB2988/.jpg" alt=" -In the figure
Q157: A rise in the price level causes