Multiple Choice
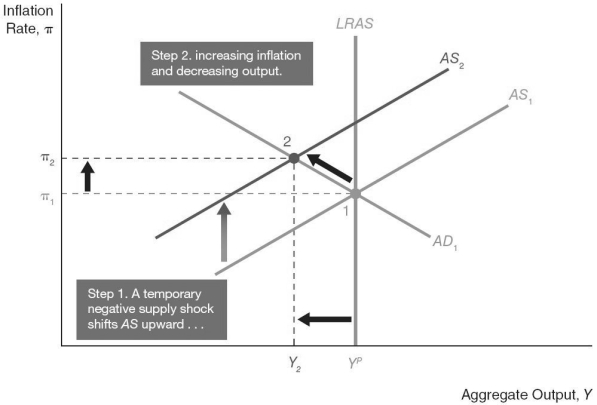
Figure 24-1

-In Figure 24.1 above, at point 2, the shift of the aggregate supply curve from AS₁ to AS₂ is a result of ________ wages that ________ production cost.
A) increasing; increase
B) increasing; reduce
C) decreasing; decrease
D) decreasing; increase
Correct Answer:

Verified
Correct Answer:
Verified
Q4: Assuming the economy is starting at the
Q31: Suppose the economy is producing at the
Q35: The Chinese central bank is _.<br>A) Hong
Q43: An unfavourable supply shock causes _ to
Q44: The long-run rate of unemployment to which
Q49: One way to derive aggregate demand is
Q50: According to aggregate demand and supply analysis,the
Q60: Explain and demonstrate graphically the effects of
Q96: Figure 24-1 <br> <img src="https://d2lvgg3v3hfg70.cloudfront.net/TB5039/.jpg" alt="Figure 24-1
Q98: The modern Phillips curve incorporates _ into