Multiple Choice
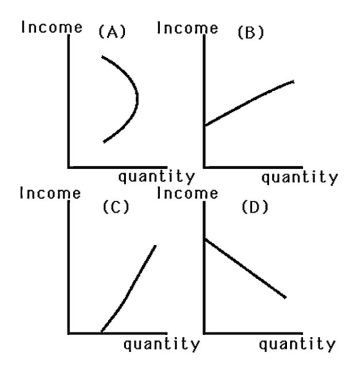
-Which graph in the above figure best represents a good that is an inferior good at some income levels,and a normal good at other income levels?
A) Graph A
B) Graph B
C) Graph C
D) Graph D
Correct Answer:

Verified
Correct Answer:
Verified
Related Questions
Q32: If Bobby thinks that leisure is an
Q33: Suppose the typical consumer only purchases food
Q34: Three individuals have $1000 and identical preferences
Q35: <img src="https://d2lvgg3v3hfg70.cloudfront.net/TB6808/.jpg" alt=" -The above figure
Q36: The belief that a cut in the
Q38: In response to an increase in the
Q39: Under which of the following conditions will
Q40: If a person supplies fewer hours of
Q41: Suppose a person's utility for leisure (L)and
Q42: One characteristic of a Giffen good is