Multiple Choice
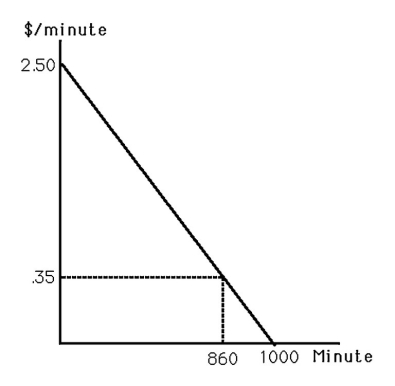
-The above figure shows the market demand curve for telecommunication while driving one's car (time spent on the car phone) .At the current price of 35¢ per minute,consumer surplus equals
A) $301.
B) $924.50.
C) $1,225.50.
D) $1,250.
Correct Answer:

Verified
Correct Answer:
Verified
Related Questions
Q22: Ian views playing Wartcraft and drinking soda
Q23: The difference between the equivalent variation and
Q24: What does it mean to say the
Q27: <img src="https://d2lvgg3v3hfg70.cloudfront.net/TB3096/.jpg" alt=" -The above figure
Q28: Julia is offered two options of government
Q29: Sarah and David both have linear demand
Q30: Shin's uncompensated demand for widgets is given
Q38: In response to an increase in the
Q40: If a person supplies fewer hours of
Q152: As the price of a good increases,the