Multiple Choice
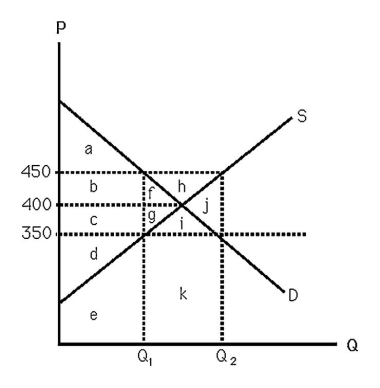
-The above figure shows supply and demand curves for apartment units in a large city.The area "e" represents
A) the loss in producer surplus if a rent ceiling of $350 is imposed.
B) the total variable cost of supplying Q1 units.
C) the marginal cost of supplying Q1 units.
D) the total revenue received by supplying Q1 units.
Correct Answer:

Verified
Correct Answer:
Verified
Q94: Which of the following is a potential
Q95: The welfare loss from an import quota
Q96: In 2007,the National Collegiate Athletic Association put
Q97: In the short run,if a firm operates,it
Q98: <img src="https://d2lvgg3v3hfg70.cloudfront.net/TB6808/.jpg" alt=" -The above figure
Q100: Suppose a consumer advocacy group has convinced
Q101: <img src="https://d2lvgg3v3hfg70.cloudfront.net/TB6808/.jpg" alt=" -The above figure
Q102: The welfare loss of a tariff equals
Q103: A competitive market maximizes social welfare because
Q104: <img src="https://d2lvgg3v3hfg70.cloudfront.net/TB6808/.jpg" alt=" -The above figure