Multiple Choice
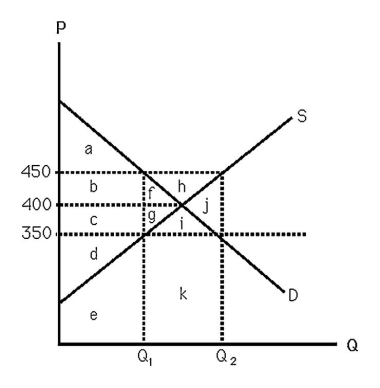
-The above figure shows supply and demand curves for apartment units in a large city.The area "c" represents
A) the loss in consumer surplus if a rent ceiling of $350 is imposed.
B) a transfer from producers to consumers if a rent ceiling of $350 is imposed.
C) a transfer from consumers to producers if a rent ceiling of $350 is imposed.
D) the total revenue received by supplying Q1 units.
Correct Answer:

Verified
Correct Answer:
Verified
Q141: <img src="https://d2lvgg3v3hfg70.cloudfront.net/TB6808/.jpg" alt=" -The above figure
Q142: <img src="https://d2lvgg3v3hfg70.cloudfront.net/TB6808/.jpg" alt=" -The above figure
Q143: <img src="https://d2lvgg3v3hfg70.cloudfront.net/TB6808/.jpg" alt=" -The above figure
Q144: <img src="https://d2lvgg3v3hfg70.cloudfront.net/TB6808/.jpg" alt=" -The above figure
Q145: Consumer surplus from a given purchase is
Q147: The cost of lobbying for an import
Q148: Changes in a firm's profit induce _
Q149: <img src="https://d2lvgg3v3hfg70.cloudfront.net/TB6808/.jpg" alt=" -The above figure
Q150: The change in total welfare from a
Q151: Explain why a government would impose an