Multiple Choice
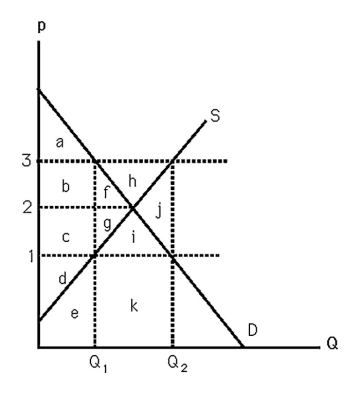
-The above figure shows supply and demand curves for milk.If the government passes a $2 per gallon specific tax,the tax revenue is
A) $2 ∗ Q₁.
B) $2 ∗ Q₂.
C) $2 ∗ (Q₂ - Q₁) .
D) $2.
Correct Answer:

Verified
Correct Answer:
Verified
Related Questions
Q7: Advocates of steel tariffs to protect American
Q34: <img src="https://d2lvgg3v3hfg70.cloudfront.net/TB5321/.jpg" alt=" -The above figure
Q37: Competitive firms earn zero profit in the
Q48: If a market produces a level of
Q52: Deadweight loss occurs when<br>A) producer surplus is
Q61: <img src="https://d2lvgg3v3hfg70.cloudfront.net/TB3096/.jpg" alt=" -The above figure
Q72: Firms are _ with an economic profit
Q73: The services of real estate brokers are
Q90: Tariffs and quotas create a loss in
Q119: The services of real estate brokers are