Essay
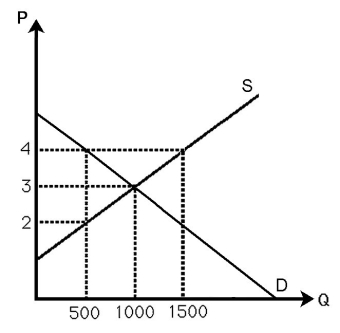
-The above figure shows the demand and supply curves in the market for milk.Currently the market is in equilibrium.If the government establishes a $2 per gallon price ceiling to ensure that children are nourished,estimate the change in p,Q,and social welfare.
Correct Answer:

Verified
At a price of $2,only 500 gall...View Answer
Unlock this answer now
Get Access to more Verified Answers free of charge
Correct Answer:
Verified
View Answer
Unlock this answer now
Get Access to more Verified Answers free of charge
Q37: When is the profit a firm earns
Q38: What is one reason perfectly competitive firms
Q39: If in a market the last unit
Q40: The services of real estate brokers are
Q41: Consumers seek to<br>A) maximize profits.<br>B) maximize expected
Q43: Assume the price of tomatoes increases.Which of
Q44: Which of the following expressions can be
Q45: <img src="https://d2lvgg3v3hfg70.cloudfront.net/TB6808/.jpg" alt=" -The above figure
Q46: Producer surplus equals<br>A) total revenue minus total
Q47: Economists claim that measuring society's welfare as