Multiple Choice
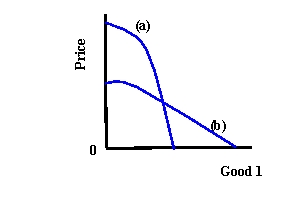
-Refer to Exhibit 4-4. Which curve represents the compensated demand function?
A) (a)
B) (b)
C) There is not enough information to give an answer.
Correct Answer:

Verified
Correct Answer:
Verified
Q17: <img src="https://d2lvgg3v3hfg70.cloudfront.net/TB5736/.jpg" alt=" -Refer to Exhibit
Q18: <img src="https://d2lvgg3v3hfg70.cloudfront.net/TB5736/.jpg" alt=" -Refer to Exhibit
Q19: The substitution effect must always be _
Q20: An inferior good is a good for
Q21: A demand curve represents graphically the relationship
Q23: The primary difference between compensated and uncompensated
Q24: The price-consumption path is the curve<br>A) representing
Q25: Demand curves are generated by the<br>A) utility-maximizing
Q26: The substitution effect is the<br>A) change in
Q27: The income effect is the<br>A) change in