Multiple Choice
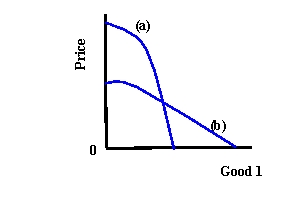
-Refer to Exhibit 4-4. Which curve represents the uncompensated demand function?
A) (a)
B) (b)
C) There is not enough information to give an answer.
Correct Answer:

Verified
Correct Answer:
Verified
Related Questions
Q25: Demand curves are generated by the<br>A) utility-maximizing
Q26: The substitution effect is the<br>A) change in
Q27: The income effect is the<br>A) change in
Q28: A normal is a good whose demand
Q31: A Giffen good is a good whose
Q32: Markets in which the identity of the
Q33: The ratio that tells how much a
Q34: Describe how prices are set in impersonal
Q35: A good for which demand increases as
Q36: <img src="https://d2lvgg3v3hfg70.cloudfront.net/TB5736/.jpg" alt=" -Refer to Exhibit