Multiple Choice
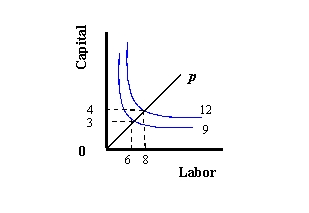
Exhibit 8-1
(a)
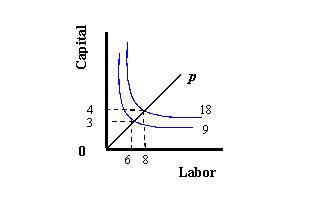
(b)
(c)

-Refer to Exhibit 8-1. Which graph depicts increasing returns to scale?
A) (a)
B) (b)
C) (c)
Correct Answer:

Verified
Correct Answer:
Verified
Related Questions
Q1: A period of time so short that
Q2: An production indifference curve is the set
Q3: If all inputs are doubled and the
Q4: Opportunity cost is measured by the amount
Q5: The assumption that states that, if there
Q7: Why is normal profit the minimum amount
Q8: The assumption that states that, if an
Q9: The increase in the amount of output
Q10: An example of a total product curve
Q11: The assumption that states that, if we