Multiple Choice
The diagram below represents the market for butter.
FIGURE 4-1
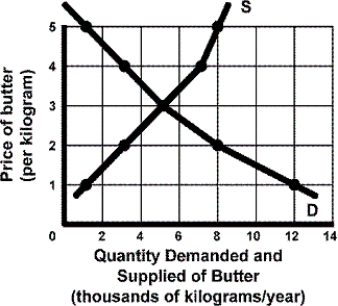
-Refer to Figure 4-1. What is the shortage or surplus that exists at a market price of $4?
A) a shortage exists equal to 4000 kilograms of butter
B) a surplus equal to 4000 kilograms of butter
C) a surplus equal to 7000 kilograms of butter
D) a shortage equal to 7000 kilograms of butter
Correct Answer:

Verified
Correct Answer:
Verified
Q66: A major grocery store chain switches from
Q67: TABLE 4-5<br> <img src="https://d2lvgg3v3hfg70.cloudfront.net/TB5767/.jpg" alt="TABLE 4-5
Q68: Ceteris paribus, if the market demand for
Q69: Which of the following statements describes equilibrium
Q70: If both the supply and demand curves
Q72: A March 2009 article in the Zimbabwe
Q73: If the market for peaches is in
Q74: A surplus exists in the market for
Q75: If Canadian consumers decided to boycott grapes
Q76: What could explain an increase in the