Multiple Choice
The diagram below represents the market for butter.
FIGURE 4-1
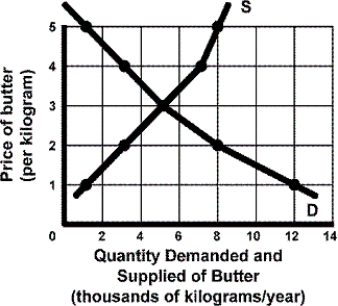
-Refer to Figure 4-1. If a price floor of $4 is imposed, how many units of butter will be sold?
A) 3000
B) 4000
C) 5000
D) 7000
Correct Answer:

Verified
Correct Answer:
Verified
Q111: Which of the following is NOT likely
Q112: Starting from an initial equilibrium price, a
Q113: What will occur in the market when
Q114: FIGURE 4-4<br> <img src="https://d2lvgg3v3hfg70.cloudfront.net/TB5767/.jpg" alt="FIGURE 4-4
Q115: Medical authorities announced in the late 1980s
Q117: Assume a price floor is imposed in
Q118: FIGURE 4-3<br> <img src="https://d2lvgg3v3hfg70.cloudfront.net/TB5767/.jpg" alt="FIGURE 4-3
Q119: TABLE 4-4<br> <img src="https://d2lvgg3v3hfg70.cloudfront.net/TB5767/.jpg" alt="TABLE 4-4
Q120: A more efficient process for refining oil
Q121: Technological progress increases the efficiency of mass