Multiple Choice
Figure 9-4
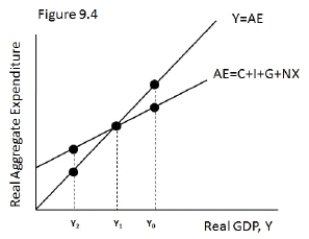
-Refer to Figure 9-4.Which of the following best describes the relationship between output and desired spending at Y₀?
A) Output is less than desired spending, and inventories will fall.
B) Output is greater than desired spending, and inventories will rise.
C) Output is less than desired spending, and governments must decrease spending.
D) Output is greater than desired spending, and real wealth will fall.
Correct Answer:

Verified
Correct Answer:
Verified
Q11: When output is higher than the intersection
Q12: When SRAS and AD intersect at the
Q13: The long-run level of real GDP changes
Q14: Which of the following changes would shift
Q15: If there was no profit effect,but there
Q17: Figure 9-1<br> <img src="https://d2lvgg3v3hfg70.cloudfront.net/TB5766/.jpg" alt="Figure 9-1
Q18: Which of the following could begin an
Q19: What effect will the combination of a
Q20: What impact will a temporary increase in
Q21: If wages increase 10 percent while worker