Multiple Choice
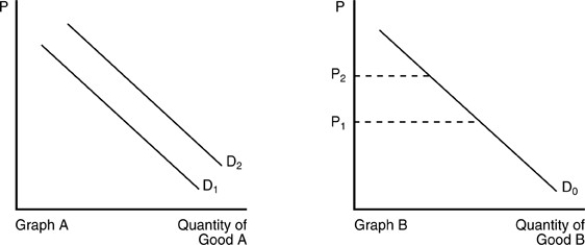
-In the above figure, when the price of Good B increases, the result can be shown by
A) the movement from D₁ to D₂ in Graph A.
B) the movement from D₂ to D₁ in Graph A.
C) the movement along D₀ from P₁ to P₂.
D) the movement along D₀ from P₂ to P₁.
Correct Answer:

Verified
Correct Answer:
Verified
Q85: Which of the following statements is FALSE?<br>A)
Q117: All of the following cause a shift
Q161: Four points on a demand schedule are
Q163: The price of a new textbook increases
Q164: Which of the following illustrates the law
Q167: Which one of the following would cause
Q168: When there is a shortage I. there
Q203: The market demand curve for a particular
Q323: <img src="https://d2lvgg3v3hfg70.cloudfront.net/TB5018/.jpg" alt=" -Refer to the
Q376: Demand applies to which of the following?<br>A)