Multiple Choice
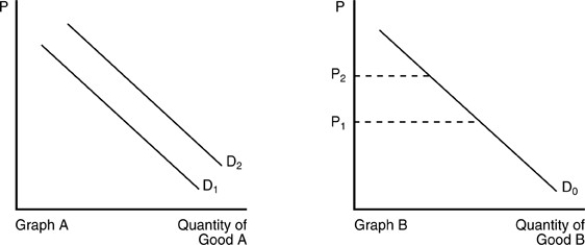
-In the above figure, an increase in income is best demonstrated by a
A) shift of D₁ to D₂ in Graph A, if good A is a normal good.
B) shift of D₂ to D₁ in Graph A, if good A is a normal good.
C) movement along D₀ from P₁ to P₂ in Graph B.
D) movement along D₀ from P₂ to P₁ in Graph B.
Correct Answer:

Verified
Correct Answer:
Verified
Q20: <img src="https://d2lvgg3v3hfg70.cloudfront.net/TB5018/.jpg" alt=" -Which of the
Q131: The price of a new textbook increases
Q147: <img src="https://d2lvgg3v3hfg70.cloudfront.net/TB5018/.jpg" alt=" -Refer to the
Q240: The direct relationship between changes in price
Q244: Which of the following is an example
Q245: The money price of a good is
Q250: After the price of milk increases, David
Q252: A shortage will occur whenever<br>A)price is below
Q297: <img src="https://d2lvgg3v3hfg70.cloudfront.net/TB5018/.jpg" alt=" -What happens as
Q369: Assuming that turkey, chicken, pork, and beef