Multiple Choice
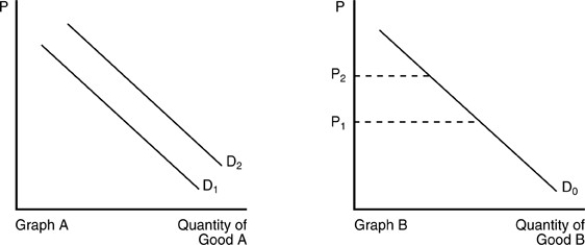
-In the above figure, the demand curve for Good A shifts from D₁ to D₂ in Graph A when the price of Good B changes from P₁ to P₂ in Graph B. We can conclude that
A) Good A and Good B are substitutes.
B) Good A and Good B are complements.
C) Good A is a normal good but Good B is an inferior good.
D) Good A and Good B are unrelated.
Correct Answer:

Verified
Correct Answer:
Verified
Q33: Distinguish between a change in demand and
Q87: A shift of the demand curve to
Q161: <img src="https://d2lvgg3v3hfg70.cloudfront.net/TB5018/.jpg" alt=" -What situation gives
Q213: If goods X and Y are substitute
Q270: A movement along a demand curve is<br>A)
Q287: The market supply curve can be derived
Q300: Explain how a market demand curve is
Q393: A significant increase in the price of
Q404: Which of the following statements is FALSE
Q406: <img src="https://d2lvgg3v3hfg70.cloudfront.net/TB5018/.jpg" alt=" -Refer to the