Multiple Choice
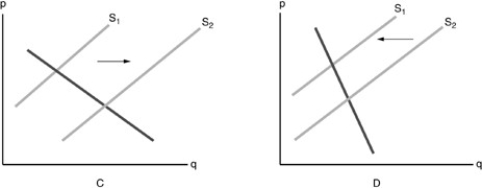
-Refer to the above figure. Corn is an input for producing Corn Flakes. Which diagram shows the effect on the supply of Corn Flakes when the price of corn has increased?
A) graph C
B) graph D
C) neither graph
D) both graphs
Correct Answer:

Verified
Correct Answer:
Verified
Related Questions
Q1: An expected increase in the future price
Q69: Which of the following causes a decrease
Q101: An inferior good is one for which<br>A)
Q152: When the price of tablet devices decreased
Q204: The demand curve shows the relationship between
Q213: If goods X and Y are substitute
Q260: Which of the following will occur as
Q287: The market supply curve can be derived
Q381: <img src="https://d2lvgg3v3hfg70.cloudfront.net/TB5016/.jpg" alt=" -Using the above
Q388: An expected future increase in the price