Multiple Choice
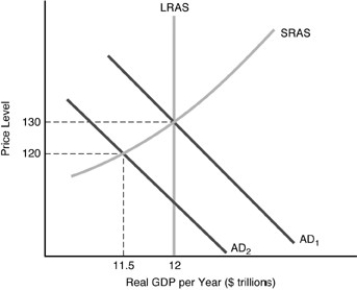
-In the above figure, if the relevant aggregate demand curve is AD₂, what are the short-run equilibrium price level and real GDP?
A) 130 and $12 trillion
B) 130 and $11.5 trillion
C) 120 and $11.5 trillion
D) 120 and $12 trillion
Correct Answer:

Verified
Correct Answer:
Verified
Q4: A stronger dollar leads to lower input
Q15: Which of the following will shift the
Q72: Which one of the following statements is
Q76: According to classical theory, desired saving always
Q105: If aggregate demand and nominal GDP increase
Q151: Cost-push inflation can be shown on an
Q192: In the above figure, an increase in
Q215: Keynes argued that an economy could be
Q231: The short-run aggregate supply (SRAS) curve represents
Q308: <img src="https://d2lvgg3v3hfg70.cloudfront.net/TB5016/.jpg" alt=" -Consider the above