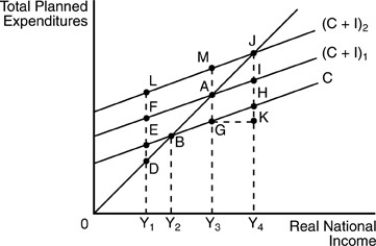
Multiple Choice

-In the above figure, at an income level of Y₃ and planned expenditures of (C + I) ₁,
A) planned saving exceeds planned investment.
B) the economy is in equilibrium.
C) the quantity of aggregate demand exceeds real Gross Domestic Product (GDP) .
D) there is full employment.
Correct Answer:

Verified
Correct Answer:
Verified
Q63: <img src="https://d2lvgg3v3hfg70.cloudfront.net/TB5018/.jpg" alt=" -Refer to the
Q107: <img src="https://d2lvgg3v3hfg70.cloudfront.net/TB5018/.jpg" alt=" -Refer to the
Q246: A permanent increase in autonomous investment causes<br>A)
Q293: If your real disposable income goes up
Q297: Suppose the marginal propensity to consume (MPC)is
Q368: Which of the following changes will shift
Q379: <img src="https://d2lvgg3v3hfg70.cloudfront.net/TB5018/.jpg" alt=" -Refer to the
Q386: Autonomous real investment spending is<br>A) the level
Q408: The multiplier tells us the relationship between<br>A)
Q422: <img src="https://d2lvgg3v3hfg70.cloudfront.net/TB5018/.jpg" alt=" -In the above