Multiple Choice
Refer to the following figure to answer the questions that follow.
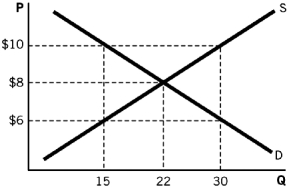
-Which of the quantity (Q) and price (P) combinations in the figure represents the market at competitive equilibrium?
A) (15, $10)
B) (15, $6)
C) (22, $8)
D) (30, $6)
E) (30, $10)
Correct Answer:

Verified
Correct Answer:
Verified
Q13: Changes in population can<br>A) alter the supply
Q33: During the hot summer months,more people want
Q59: Something is a normal good if the
Q107: When the government places a tax on
Q108: Refer to the following figure to answer
Q111: As more people migrated West during the
Q114: You are given the following supply and
Q115: The economists at JET Consulting consider Campbell's
Q116: When both curves shift:<br>A) equilibrium price is
Q142: In 1993,the government increased the tax on