Multiple Choice
The change in equilibrium shown in the accompanying figure would be explained by a(n) ________ in the price of an input and a(n) ________ in the price of a ________.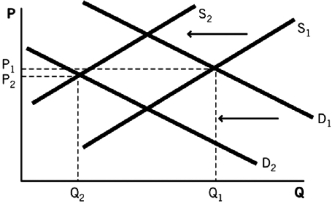
A) increase; increase; complement
B) decrease; increase; complement
C) decrease; increase; substitute
D) increase; decrease; complement
E) increase; increase; substitute
Correct Answer:

Verified
Correct Answer:
Verified
Q35: Spam is considered an inferior good.What would
Q53: Susie decided to start selling lemonade on
Q54: To keep the percentage change in quantity
Q59: After the invention of the cotton gin
Q60: Assume that the market for cheeseburgers consists
Q61: There is a competitive market for dog
Q62: If the price of a good increases,holding
Q63: During a national recession,we see the income
Q67: Compare and contrast the following sets of
Q113: What happens to the equilibrium price and