Multiple Choice
Refer to the following graph to answer the questions that follow.
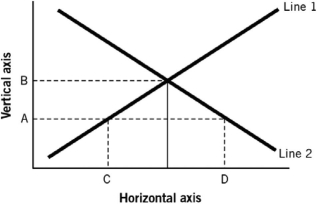
-Assuming the figure represents the market for loanable funds,and that point C represents 40 and point D represents 80,then it would be true that:
A) both points represent interest rates and there is a surplus of loanable funds at an 80% interest rate.
B) both points represent interest rates and there is a shortage of loanable funds at an 80% interest rate.
C) both points represent the quantity of loanable funds and there would be a surplus of loanable funds of 40 units.
D) both points represent the quantity of loanable funds and at interest rate A there would be a shortage of loanable funds of 40 units.
E) the quantity of loanable funds supplied exceeds the quantity demanded at interest rate B, if B represents an interest rate.
Correct Answer:

Verified
Correct Answer:
Verified
Q4: You are thinking about buying a new
Q6: The timeline of production would indicate:<br>A) supply
Q7: By 1981:<br>A) interest rates were about 5%.<br>B)
Q8: You borrow $10,000 today at a nominal
Q10: If household income falls and governments run
Q13: The real interest rate in 2012 was:<br>A)
Q85: If time preferences increase,<br>A) the demand for
Q104: Foreign entities<br>A) are generally borrowers of domestic
Q115: The measurement of personal savings may be
Q156: Typically a college degree is "worth it,"