Multiple Choice
Insert non-labeled graph from page 150- replica created and inserted below 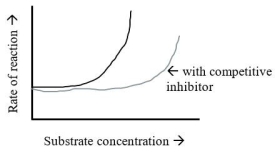
The graph shows the normal reaction rate of an enzyme and the reaction rate when a competitive inhibitor is present.Which description below explains the appearance of the graph?
A) As the substrate concentration increases,the activity of the enzyme decreases.
B) As the substrate concentration increases,the effect of the inhibitor was overcome and enzyme activity was restored.
C) As the enzyme concentration increased,the effect of the inhibitor was overcome and enzyme activity was restored.
D) As the enzyme concentration increased,the effect of the inhibitor was more pronounced.
E) As the competitive inhibitor concentration decreased,the reaction rate also decreased.
Correct Answer:

Verified
Correct Answer:
Verified
Q1: Figure 5.8<br> <img src="https://d2lvgg3v3hfg70.cloudfront.net/TB6915/.jpg" alt="Figure 5.8
Q2: You look in the refrigerator and find
Q4: In non-cyclic photophosphorylation,excited electrons ultimately<br>A)return to chlorophyll.<br>B)are
Q5: Figure 5.8<br> <img src="https://d2lvgg3v3hfg70.cloudfront.net/TB6915/.jpg" alt="Figure 5.8
Q6: Summarize energy production in cells in a
Q7: A bacterium such as Pseudomonas uses nitrate
Q8: Which of the following statements about anaerobic
Q9: Carbon fixation occurs during the light-independent phase
Q10: Cyanobacteria are a type of<br>A)chemoautotroph.<br>B)chemoheterotroph.<br>C)photoautotroph.<br>D)photoheterotroph.
Q11: Which biochemical process is NOT used during