Multiple Choice
Consider the following frequency distributions generated by Excel.What is the missing cumulative % value identified by the asterisk? 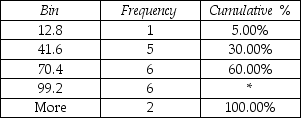
A) 60.00%
B) 5) 00%
C) 100%
D) 90%
Correct Answer:

Verified
Correct Answer:
Verified
Related Questions
Q31: An ogive is also called a cumulative
Q32: The role of inferential statistics is to
Q33: Draw a stem-and-leaf display to describe the
Q34: As a businessperson,in what ways may you
Q35: Bar charts and pie charts are commonly
Q37: A parameter is a descriptive measure computed
Q38: A consumer goods company has been studying
Q39: Procedures used to describe data in simple
Q40: A line chart is also called a
Q41: A pie chart typically depicts the proportion