Multiple Choice
THE NEXT QUESTIONS ARE BASED ON THE FOLLOWING INFORMATION:
A professor of statistics is interested in studying the relationship between the number of hours graduate students spent studying for his comprehensive final exam and the exam score.The results of the regression analysis of hours studied on exam scores are presented below. 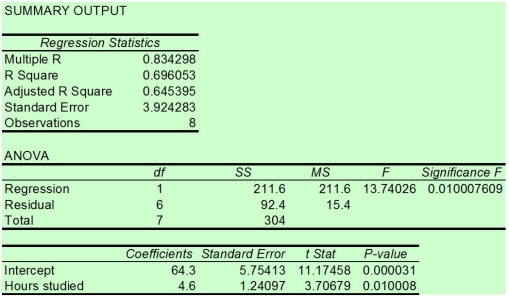
-Which of the following is used to plot the dependent variable versus the independent variable?
A) a histogram
B) a bar chart
C) a pie chart
D) a scatter diagram
Correct Answer:

Verified
Correct Answer:
Verified
Q54: The smaller the sample size,the smaller the
Q55: THE NEXT QUESTIONS ARE BASED ON THE
Q56: THE NEXT QUESTIONS ARE BASED ON THE
Q57: Which of the following is the value
Q58: What is the correlation coefficient for the
Q60: The forecaster obtained an estimated equation for
Q61: THE NEXT QUESTIONS ARE BASED ON THE
Q62: If the coefficient of determination is 0.64,the
Q63: THE NEXT QUESTIONS ARE BASED ON THE
Q64: The management of a local hotel is