Essay
Suppose a scatter plot of your data between X and Y looks as shown below.How might you model Y? 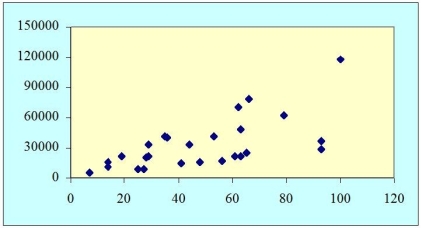
Correct Answer:

Verified
Need to have both dummy variab...View Answer
Unlock this answer now
Get Access to more Verified Answers free of charge
Correct Answer:
Verified
Need to have both dummy variab...
View Answer
Unlock this answer now
Get Access to more Verified Answers free of charge
Related Questions
Q121: THE NEXT QUESTIONS ARE BASED ON THE
Q122: The range of the values of the
Q123: Explain what is meant by heteroscedasticity.What effects
Q124: If there is a positive correlation between
Q125: Which of the following distributions is used
Q127: Which of the following regression diagnostic tools
Q128: Write a model specification and define the
Q129: Positive correlation leads to small values of
Q130: THE NEXT QUESTIONS ARE BASED ON THE
Q131: Removing an independent variable that is highly