Essay
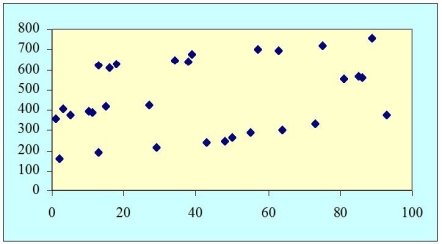
Suppose a scatter plot of your data between X and Y looks as shown below.How might you model Y? 
Correct Answer:

Verified
Need to use dummy variables.Si...View Answer
Unlock this answer now
Get Access to more Verified Answers free of charge
Correct Answer:
Verified
Need to use dummy variables.Si...
View Answer
Unlock this answer now
Get Access to more Verified Answers free of charge
Related Questions
Q11: From the regression results we calculate a
Q12: When time-series data are analyzed,the error term
Q13: Which of the following tests can be
Q14: What does the following plot of residuals
Q17: Suppose you are interested in examining the
Q18: THE NEXT QUESTIONS ARE BASED ON THE
Q19: When all the coefficient student t statistics
Q20: THE NEXT QUESTIONS ARE BASED ON THE
Q21: Consider the regression model <img src="https://d2lvgg3v3hfg70.cloudfront.net/TB2968/.jpg" alt="Consider
Q114: If the value of the Durbin-Watson statistic,d,satisfies