True/False
The figures used in calculating the test statistic X2 = 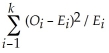
are the observed and expected numbers in each of the k categories.However,it is correct,for example,to use instead the percentages of sample members in each category.
Correct Answer:

Verified
Correct Answer:
Verified
Q82: One disadvantage of nonparametric tests is that,under
Q83: Consider the following data set: 16,16,17,18,20,21,21,22,23,24,25,27,27,27,27,and 30.The
Q84: THE NEXT QUESTIONS ARE BASED ON THE
Q85: A Wilcoxon rank sum test for comparing
Q86: The chi-square distribution approaches the normal distribution
Q88: Minitab statistical software can be used to
Q89: Nonparametric procedures have fewer restrictive assumptions concerning
Q90: A test of independence is to be
Q91: THE NEXT QUESTIONS ARE BASED ON THE
Q92: A chi-square goodness-of-fit-test is being used to