Multiple Choice
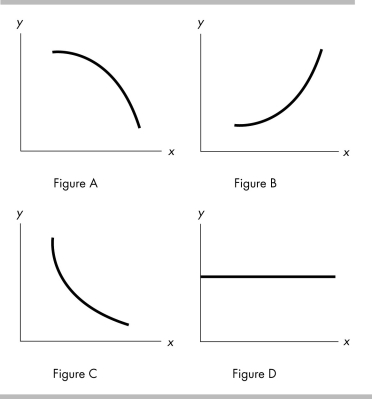
-In the above figure, which of the graphs demonstrates a curve with a decreasing slope, that is, a slope getting smaller in magnitude as x increases?
A) Figure A
B) Figure B
C) Figure C
D) Figure D
Correct Answer:

Verified
Correct Answer:
Verified
Q3: <img src="https://d2lvgg3v3hfg70.cloudfront.net/TB8586/.jpg" alt=" -What does the
Q191: Suppose that the government of New York
Q192: <img src="https://d2lvgg3v3hfg70.cloudfront.net/TB8586/.jpg" alt=" -The slope in
Q193: Factors of production include<br>A) the economic system.<br>B)
Q194: Which of the following is a normative
Q195: A positive statement is<br>A) about what ought
Q197: Because we face scarcity, every choice involves<br>A)
Q198: Today, Julie attended her 12:30 Economics class.
Q199: When Susan makes the statement, "The government
Q200: Human capital is<br>A) all capital owned by