Multiple Choice
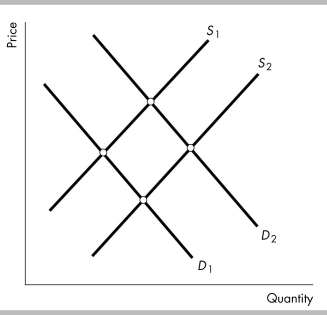
-The figure above shows the market for candy. People become more concerned that eating candy causes them to gain weight, which they do not like. As a result, the
A) demand curve shifts from D2 to D1 and the supply curve does not shift.
B) demand curve shifts from D1 to D2 and the supply curve shifts from S1 to S2.
C) demand curve shifts from D2 to D1 and the supply curve shifts from S2 to S1.
D) demand curve does not shift, and the supply curve shifts from S1 to S2.
Correct Answer:

Verified
Correct Answer:
Verified
Q91: Suppose a medical study reveals new benefits
Q94: A movement along the demand curve shows
Q166: If a producer can use resources to
Q208: Students can rent a Blu-ray movie at
Q231: If the demand and supply curves are
Q257: Georgine buys more sweaters when her income
Q317: The interaction of supply and demand explains<br>A)
Q320: An increase in technology for producing personal
Q393: <img src="https://d2lvgg3v3hfg70.cloudfront.net/TB3035/.jpg" alt=" -In the above
Q482: Which of the following does NOT shift