Multiple Choice
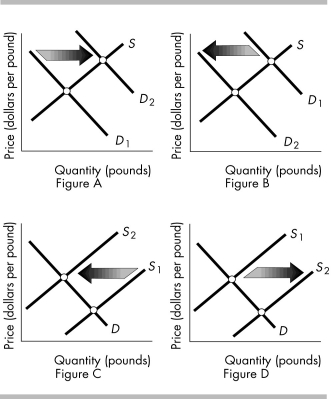
-The above figures show the market for oranges. Which figure(s) shows the effect of an increase in the price of bananas, a substitute for oranges?
A) Figure A
B) Figure C
C) Figure D
D) Figure A and C
Correct Answer:

Verified
Correct Answer:
Verified
Q483: A shortage causes the<br>A) demand curve to
Q484: The equilibrium price will fall and the
Q485: The price of a gallon of milk
Q486: <img src="https://d2lvgg3v3hfg70.cloudfront.net/TB8586/.jpg" alt=" -The above table
Q487: Suppose a market begins in equilibrium. If
Q489: When the price of a pizza decreases
Q490: Scarcity guarantees that<br>A) demands will exceed wants.<br>B)
Q491: Which of the following does NOT shift
Q492: Changes in which of the following shifts
Q493: <img src="https://d2lvgg3v3hfg70.cloudfront.net/TB8586/.jpg" alt=" -The above table