Multiple Choice
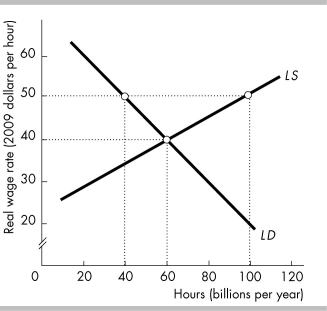
-In the above figure, what is the full-employment real wage rate and quantity of hours per year?
A) $40 and 60 billion hours per year
B) $50 and 100 billion hours per year
C) $35 and 100 billion hours per year
D) $50 and 40 billion hours per year
Correct Answer:

Verified
Correct Answer:
Verified
Related Questions
Q128: The supply of labor curve is<br>A) vertical
Q129: A key feature of the new growth
Q131: According to UNESCO reporting, "Governments in North
Q132: The labor demand curve slopes downward because<br>A)
Q134: The real wage rate will fall if
Q135: Over the past 100 years, in the
Q136: An increase in physical capital or a
Q137: As labor increases, there is a<br>A) shift
Q138: The real wage rate equals<br>A) (money wage
Q318: According to the Economic Times (09/2012), Standard