Multiple Choice
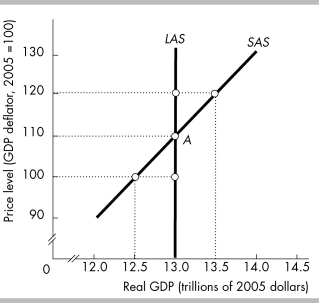
-In the figure above,the economy is at point A when the price level falls to 100.Money wage rates and all other resource prices remain constant.Firms are willing to supply output equal to
A) $12.5 trillion.
B) $13.0 trillion.
C) $13.5 trillion.
D) None of the above answers is correct.
Correct Answer:

Verified
Correct Answer:
Verified
Q2: <img src="https://d2lvgg3v3hfg70.cloudfront.net/TB3035/.jpg" alt=" -Suppose the economy
Q134: The long-run aggregate supply curve is vertical
Q143: <img src="https://d2lvgg3v3hfg70.cloudfront.net/TB8586/.jpg" alt=" -The data in
Q169: An increase in aggregate demand is shown
Q172: In a change to immigration policy during
Q192: When real GDP exceeds potential GDP, then
Q263: In the long-run, the quantity of real
Q279: One result of a decrease in aggregate
Q299: Suppose that the economy begins at a
Q349: <img src="https://d2lvgg3v3hfg70.cloudfront.net/TB8586/.jpg" alt=" -In the above