Multiple Choice
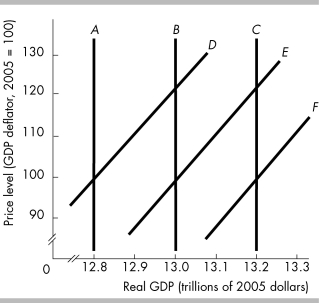
-In the above figure,B is the current long-run aggregate supply curve and E is the current short-run aggregate supply curve.If there is an increase in the full-employment quantity of labor,then the long-run aggregate supply curve and the short-run aggregate supply curve
A) remain B and E.
B) shift to A and D, respectively.
C) shift to C and F, respectively.
D) shift to A and F, respectively.
Correct Answer:

Verified
Correct Answer:
Verified
Q115: <img src="https://d2lvgg3v3hfg70.cloudfront.net/TB8586/.jpg" alt=" -In the above
Q116: <img src="https://d2lvgg3v3hfg70.cloudfront.net/TB3035/.jpg" alt=" -In the above
Q191: By using only the aggregate demand curve,
Q214: Along a short-run aggregate supply curve, a
Q233: A change in _ creates a movement
Q261: How do changes in the money wage
Q286: As the price level falls and other
Q293: An economy currently has a inflationary gap.An
Q394: In 2008, the dollar appreciated relative to
Q399: If the economy is in short run