Multiple Choice
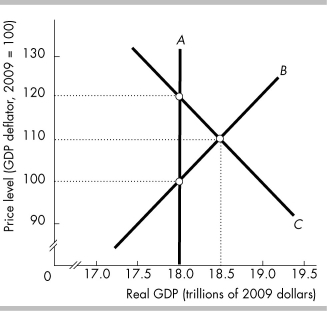
-In the above figure, curve A is the ________ curve, curve B is the ________ curve, and curve C is the ________ curve.
A) long-run aggregate supply; short-run aggregate supply; aggregate demand
B) aggregate demand; short-run aggregate supply; long-run aggregate supply
C) short-run aggregate supply; long-run aggregate supply; aggregate demand
D) long-run aggregate supply; aggregate demand; short-run aggregate supply
Correct Answer:

Verified
Correct Answer:
Verified
Q387: Fluctuations in aggregate demand and aggregate supply
Q388: An above-full-employment equilibrium is<br>A) a theoretical possibility
Q389: <img src="https://d2lvgg3v3hfg70.cloudfront.net/TB8586/.jpg" alt=" -The data in
Q390: What is the difference between a recessionary
Q391: Explain the reasons why the AD curve
Q393: <img src="https://d2lvgg3v3hfg70.cloudfront.net/TB8586/.jpg" alt=" -In the above
Q394: In 2008, the dollar appreciated relative to
Q395: Aggregate demand in India increased in 2008.
Q396: Short-run equilibrium occurs at the intersection of<br>A)
Q397: The short-run aggregate supply curve shows a