Multiple Choice
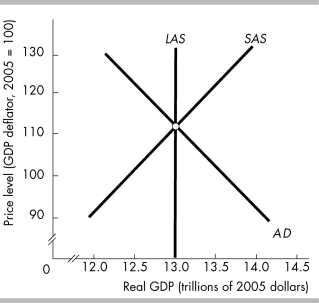
-The above figure depicts an economy with a short-run equilibrium
A) at full employment.
B) below full employment.
C) at higher than full-employment.
D) None of the above answers are correct.
Correct Answer:

Verified
Correct Answer:
Verified
Related Questions
Q45: The data in the above figure indicate
Q98: Which of the following helps determine the
Q114: The government increases taxes. As a result,
Q135: The economy is in its short run
Q160: The Great Depression, in which real GDP
Q224: An economy is at full employment. Which
Q312: Explain the relationship of the long-run aggregate
Q313: <img src="https://d2lvgg3v3hfg70.cloudfront.net/TB5273/.jpg" alt=" -In the above
Q381: Suppose the price level rises and the
Q387: Fluctuations in aggregate demand and aggregate supply