Multiple Choice
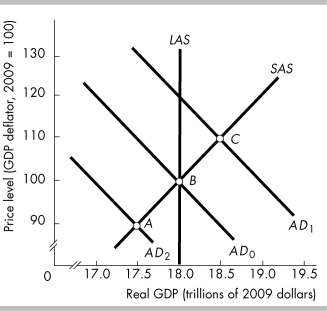
-In the above figure, point C represents
A) a recessionary gap.
B) a full-employment equilibrium.
C) an inflationary gap.
D) a decrease in aggregate demand.
Correct Answer:

Verified
Correct Answer:
Verified
Related Questions
Q362: A change in the full-employment quantity of
Q363: If you have $1,000 of money in
Q364: Which of the following events will increase
Q365: A monetarist economist believes that if the
Q366: During an above-full-employment equilibrium, actual GDP is
Q368: In 2008, Japan's economy suffered as world
Q369: <img src="https://d2lvgg3v3hfg70.cloudfront.net/TB8586/.jpg" alt=" -In the above
Q370: If the quantity of money increases, the<br>A)
Q371: If the money wage rate and other
Q372: <img src="https://d2lvgg3v3hfg70.cloudfront.net/TB8586/.jpg" alt=" -In the above