Essay
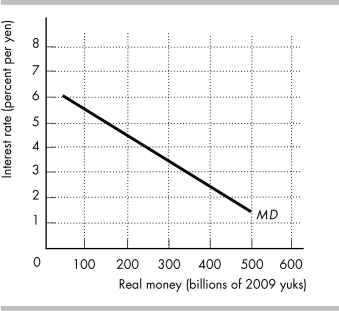
-The figure above shows the demand for money in Kiteland.
a) If the Kiteland Central Bank has set the quantity of money so that the equilibrium interest rate is 4 percent, draw the supply of money curve.
b) Suppose Kiteland's real GDP increases so that the demand for money changes by 100 billion yaks. The Kiteland Central Bank takes no actions. Show the effects of this event on your figure. What happens to the interest rate? What happens to the quantity of money in the economy?
c) If the Central Bank wants to prevent the interest rate from changing, what must it do to the quantity of money? Draw the new supply of money curve.
d) In order to change the quantity of money to keep the interest rate constant, suppose the Kiteland Central Bank uses open market operations. Does it make an open market purchase or an open market sale? Explain your answer.
Correct Answer:

Verified
 a) See the figure above. When the deman...
View Answer
Unlock this answer now
Get Access to more Verified Answers free of charge
Correct Answer:
Verified
View Answer
Unlock this answer now
Get Access to more Verified Answers free of charge
Q63: Explain how the Fed's response to a
Q64: If the Fed carries out an open
Q65: If the Fed carries out an open
Q66: "As the Fed Chases Inflation, Critics Shout,
Q67: <img src="https://d2lvgg3v3hfg70.cloudfront.net/TB8586/.jpg" alt=" -In the above
Q69: Usually, the Federal Reserve changes its target
Q70: In the short run, monetary policy can<br>A)
Q71: In the short run, an increase in
Q72: If the Fed buys U.S. government securities
Q73: If the federal funds rate is below