Multiple Choice
Figure 6-1
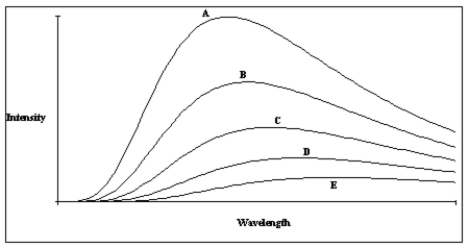
-A plot of the continuous spectra of five different stars is shown in Figure 6-1. Based on these spectra, which of the stars has the lowest temperature
A) Star A
B) Star B
C) Star C
D) Star D
E) Star E
Correct Answer:

Verified
Correct Answer:
Verified
Related Questions
Q40: One star has a temperature of
Q41: A neutral atom always contains<br>A)the same number
Q42: At what wavelength would a star
Q43: A _ will be obtained from an
Q44: The _ of a gas is a
Q46: Isotopes of the same element have the
Q47: What holds the electron to the nucleus
Q48: Describe the appearance of each of the
Q49: _ is a set of rules that
Q50: Which spectrum is shown above <img src="https://d2lvgg3v3hfg70.cloudfront.net/TB5757/.jpg"