Multiple Choice
The diagram below shows a light curve from a supernova. How many days after maximum light did it take for the supernova to decrease in brightness by a factor of 100 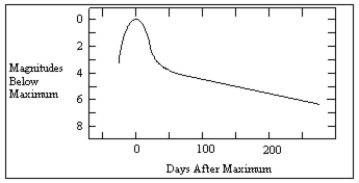
A) less than 50
B) 50
C) 150
D) 250
E) more than 250
Correct Answer:

Verified
Correct Answer:
Verified
Q72: No known white dwarf has a mass
Q73: Type Ia and Type Ib supernovae both
Q74: Why does a helium flash occur under
Q75: The Sun will eventually become a supernova.
Q76: _ clusters are compact, round, and red,
Q78: Very massive stars lose their outer layers
Q79: Synchrotron radiation is produced by<br>A)objects with temperature
Q80: A planetary nebula<br>A)produces an absorption spectrum.<br>B)produces an
Q81: As a Sun-like main-sequence star exhausts hydrogen
Q82: What properties of degenerate matter are important