Multiple Choice
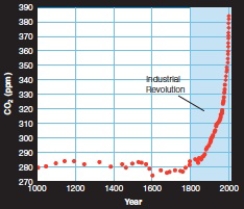
-What is the above graph showing
A) when the ozone hole formed
B) how the industrial revolution contributed to global warming
C) how the industrial revolution contributed to greenhouses gasses in Earth's atmosphere
D) None of the other choices are correct.
Correct Answer:

Verified
Correct Answer:
Verified
Related Questions
Q43: Earth possesses few visible craters and the
Q44: The greenhouse effect occurs on Earth because
Q45: The central part of Earth's core is
Q46: Explain how energy is generated inside a
Q47: On the Moon, the maria have fewer
Q49: Which of the following is not produced
Q50: Why is the ozone layer in Earth's
Q51: The greenhouse effect is bad for Earth.
Q52: Compared to Earth, wind and water erosion
Q53: What does the presence of vesicular basalts