Multiple Choice
The graph below plots the escape velocity of several solar system objects along the vertical axis and the surface temperature along the horizontal axis. The lines plotted in the figure are the speeds of the fastest gas particles as a function of temperature for various gases. Which of the objects in this diagram has the greatest surface temperature 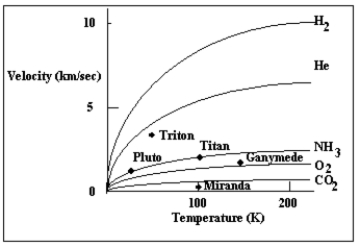
A) Ganymede
B) Pluto
C) Titan
D) Triton
E) Miranda
Correct Answer:

Verified
Correct Answer:
Verified
Q88: Jupiter's intense magnetic field traps high-energy particles
Q89: How does the magnetic field of Uranus
Q90: Saturn's atmosphere<br>A)has more distinctive zones and belts
Q91: _ is the smallest of the large
Q92: Jupiter's shape is _ because it is
Q94: Why is it believed that the rings
Q95: The graph below plots the escape velocity
Q96: The _ was a large cyclonic storm
Q97: On its icy surface, Uranus's satellite Ariel
Q98: The red line in the following picture