Multiple Choice
Use the following graph for the question.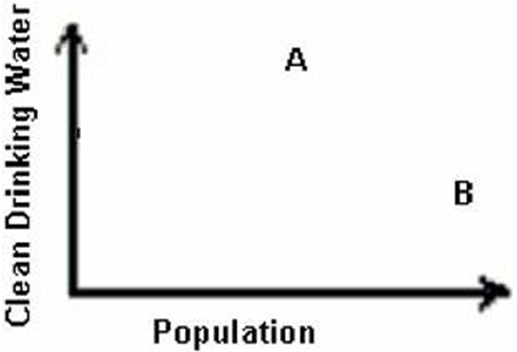
-On the graph of clean drinking water per person, each letter represents a country. Which of the following is most likely?
A) A is the United States; B is India.
B) B is the United States; A is India.
C) A is the United States; B is Canada.
D) B is India; A is China.
E) A is India; B is China
Correct Answer:

Verified
Correct Answer:
Verified
Q5: The residence time for an average water
Q12: A method of increasing water supplies that
Q13: In general, water use in poor countries
Q14: Most water in the atmosphere has evaporated
Q16: What would you not find in water
Q17: Principal problems that have resulted from the
Q18: Which of the following factors is the
Q20: Best available economically achievable technology (BAT) standards
Q39: Withdrawal is the total amount of water<br>A)lost
Q40: The city of Arcata,California,is notable because it