Multiple Choice
Exhibit 3-3 Demand curves 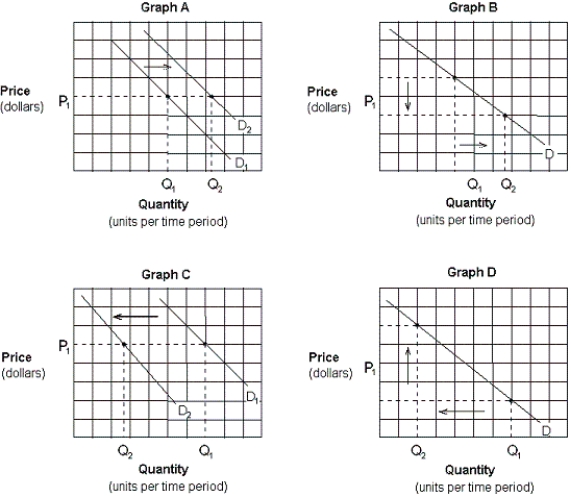
-Which of the graphs in Exhibit 3-3 depicts the effect of a decrease in the price of pizza on the demand curve for pizza?
A) Graph A.
B) Graph B
C) Graph C.
D) Graph D.
Correct Answer:

Verified
Correct Answer:
Verified
Related Questions
Q2: Which of the following would decrease the
Q155: A shift occurs in the supply curve
Q157: When the price of a good is
Q169: Which of the following will cause a
Q174: Other things being equal, the effect of
Q332: Other things being equal, a fall in
Q334: If people buy more of a generic
Q335: Which of the following will cause the
Q338: Exhibit 3A-2 Comparison of Market Efficiency and
Q339: The price of a good will fall