Multiple Choice
Exhibit 14-3 Aggregate supply and demand curves
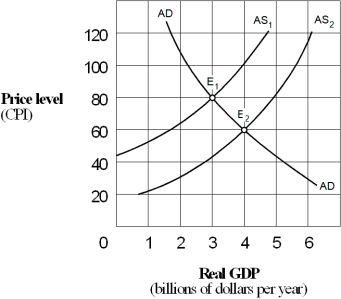
-In Exhibit 14-3,the change in equilibrium from E₁ to E₂ represents:
A) cost-push inflation.
B) demand-pull inflation.
C) price-push inflation.
D) wage-push inflation.
Correct Answer:

Verified
Correct Answer:
Verified
Q14: The net exports effect is the inverse
Q122: When the aggregate demand curve shifts to
Q123: The aggregate demand curve is downward sloping
Q124: Which of the following helps explain why
Q125: The concurrent problems of inflation and unemployment
Q128: The aggregate demand curve:<br>A) shows the level
Q129: During the Great Depression of the 1930s,the
Q130: The aggregate demand curve is drawn downward-sloping,because
Q131: Greater entrepreneurship in the economy will shift
Q132: The aggregate demand curve shows how real