Multiple Choice
Exhibit 14-4 Aggregate supply and demand curves
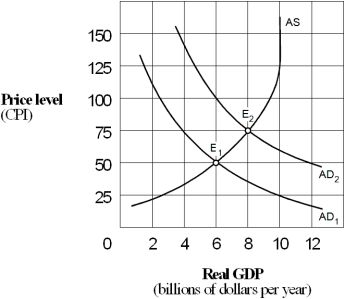
-The increase in the price level as the economy moves from E₁ to E₂ in Exhibit 14-4 represents:
A) cost-push inflation.
B) demand-shock inflation.
C) wage push inflation.
D) demand-pull inflation.
Correct Answer:

Verified
Correct Answer:
Verified
Q45: Along the intermediate range of the aggregate
Q113: Suppose the economy is on the intermediate
Q114: Demand-pull inflation is caused by:<br>A) an increase
Q115: Exhibit 14-8 Aggregate demand and supply<br> <img
Q116: An increase in input prices will cause
Q117: Exhibit 14-3 Aggregate supply and demand curves<br>
Q119: The aggregate supply curve shows the relationship
Q121: Which of the following will not shift
Q122: When the aggregate demand curve shifts to
Q123: The aggregate demand curve is downward sloping