Multiple Choice
Exhibit 14-7 Aggregate supply and demand curves
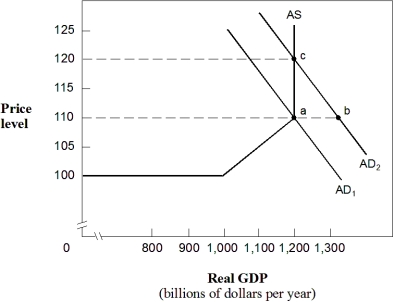
-In Exhibit 14-7,the aggregate demand and supply curves reflect an economy in which:
A) full employment is at $1,000 billion GDP.
B) excess aggregate supply is created when there is a shift from AD₁ to AD₂.
C) excess aggregate demand forces prices up to P = 120.
D) excess aggregate demand causes prices to stabilize at P = 110.
E) a new equilibrium is found at point b.
Correct Answer:

Verified
Correct Answer:
Verified
Q43: Assuming prices and wages are fully flexible,
Q82: For an economy, aggregate demand equals:<br>A) consumption
Q89: An increase in the price level caused
Q90: In the vertical segment of the aggregate
Q91: The negative slope of the aggregate demand
Q91: In the intermediate range of the aggregate
Q92: In the horizontal segment of the aggregate
Q96: A cut in government spending,a decrease in
Q97: Stagflation is a period of time when
Q144: The aggregate supply curve indicates the<br>A) relationship