Multiple Choice
Figure 7-2
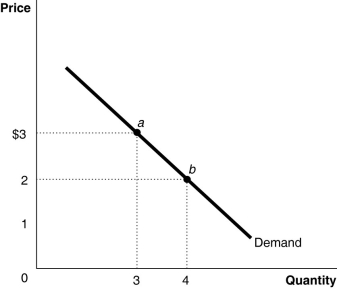 Figure 7-2 represents the demand for ice cream cones.
-Refer to Figure 7-2.Which of the following statements is true?
A) Points a and b are the utility-maximizing quantities of ice cream cones at two different prices of ice cream.
B) Points a and b may not necessarily be the utility-maximizing quantities of ice cream cones at two different prices because we have no information on the consumer's budget or the price of other goods.
C) Point a could be a utility-maximizing choice if the price is $3 but point b may not be because we have no information on the marginal utility per dollar when price changes.
D) Points a and b are derived independently of the utility-maximizing model.
Correct Answer:

Verified
Correct Answer:
Verified
Q28: If, for a given percentage increase in
Q97: Which of the following would result in
Q98: Perfectly inelastic demand is represented by a
Q111: When there few close substitutes available for
Q136: If the demand for a product is
Q150: Carolyn spends her income on popular magazines
Q154: The market demand for The Federalist Papers
Q161: Total utility<br>A)cannot decrease as a person consumes
Q187: Of the following, which is the best
Q232: Assume that the demand curve for sunblock